1.1 Evolution of Global EV Market Volume: The Leap from 10 Million to 20 Million
From 2023 to the first half of 2026, the global new energy vehicle market underwent a critical transition from scaled expansion to structural deepening. According to the International Energy Agency (IEA) "Global EV Outlook 2026" report, global electric vehicle sales exceeded the 20 million mark for the first time in 2025, a year-on-year increase of approximately 20%, with electric vehicles reaching a penetration rate of 25% among all new car sales — meaning that globally, one out of every four new cars sold is an electric vehicle IEA Global EV Outlook 2026.
The table below presents the year-by-year evolution of global EV sales and China's NEV sales from 2023–2025:
| Year | Global BEV+PHEV Sales (10k units) | China NEV Sales (10k units) | China's Global Share | Key Events |
|---|---|---|---|---|
| 2023 | ~1,400 | 949 | ~60% [Note] | China's NEV annual production and sales approaching the 10 million mark |
| 2024 | ~1,700 | 1,287 | ~60% [Note] | China's NEV annual production and sales exceed 12 million |
| 2025 | ~2,000 | 1,649 | ~65% [Note] | Global first exceed 20 million; China NEV surpasses 16 million |
| 2026(E) | ~2,300 | — | — | IEA forecasts 28% share; Q1 regional divergence significant |
[Note] Caliber Explanation: Global data is from the IEA "Global EV Outlook" series, covering BEV+PHEV sales (primarily passenger vehicles); China data is from the China Association of Automobile Manufacturers (CAAM), covering NEVs (including pure electric + plug-in hybrid, with a small number of commercial vehicles). Due to differences between IEA and Chinese statistical calibers (e.g., scope of commercial vehicle inclusion, registration-based vs. wholesale-based), the two cannot be mechanically divided to yield a precise share. The IEA noted in its GEO 2024 report that China accounted for "over 60%" of global EV sales in 2023; the actual share ranges between 60%–65% depending on caliber adjustments. Subsequent citations in this report are all approximate estimates with noted data source calibers.
Tracing the growth trajectory, global EV (BEV+PHEV) sales were approximately 14 million units in 2023, with China's NEV sales reaching 9.49 million units (CAAM caliber, including pure electric and plug-in hybrid), accounting for over 60% of the global share IEA Global EV Outlook 2026 Xinhua/CAAM; in 2024, as China's NEV production and sales exceeded 12.87 million units (a 35.5% increase), the global total climbed to approximately 17 million units China Daily/CAAM; by 2025, China's NEV production and sales both exceeded 16 million units, with sales reaching 16.49 million units (a 28.2% year-on-year increase), accounting for approximately 65% of total global EV sales Sina Finance IEA Analysis. Data from the International Council on Clean Transportation (ICCT) further confirms that over 9 million electric vehicles were sold globally in the first half of 2025, accounting for 23% of new light-duty vehicle sales ICCT EV Market Monitor H1 2025.
Entering 2026, the market experienced short-term divergence. In Q1, global electric vehicle sales were approximately 3.9 million units, a year-on-year decline of about 8%, but this aggregate figure masks robust growth across regions: Europe grew nearly 30% year-on-year, Asia-Pacific (excluding China) grew 80%, and Latin America grew 75% IEA Global EV Outlook 2026. The IEA forecasts that global EV sales will reach 23 million units for the full year 2026, accounting for 28% of total new car sales.
Summary: The global EV market is transitioning from "China's unipolar drive" to "multi-regional synergistic growth," but China — with over 60% of sales share (caliber as noted above), nearly 75% of production share, and over 80% of battery supply chain dominance — remains the absolute center of the global EV industry.
1.2 Structural Transformation of Auto Exports: NEV from Supporting Role to Lead Actor
China's automobile exports are undergoing a historic structural transformation. The data chain clearly illustrates this process:
| Year | Total Auto Exports (10k units) | Growth Rate | NEV Exports (10k units) | Growth Rate | NEV Share |
|---|---|---|---|---|---|
| 2023 | 491 | +57.9% | 120.3 | +77.6% | 24.5% |
| 2024 | 586 | +19.3% | 128.4 | +6.7% | 21.9% |
| 2025 | 709.8 | +21.1% | 261.5 | +103.7% | 36.8% |
| 2026 (Jan–May) | 405.9 | +63% | 183.3 | +110% | 45.2% |
Data sources: 2023 China.org.cn/Xinhua, 2024 China Daily/CAAM, 2025–2026 Sina Auto and 10jqka/Huaguang Yuanhai
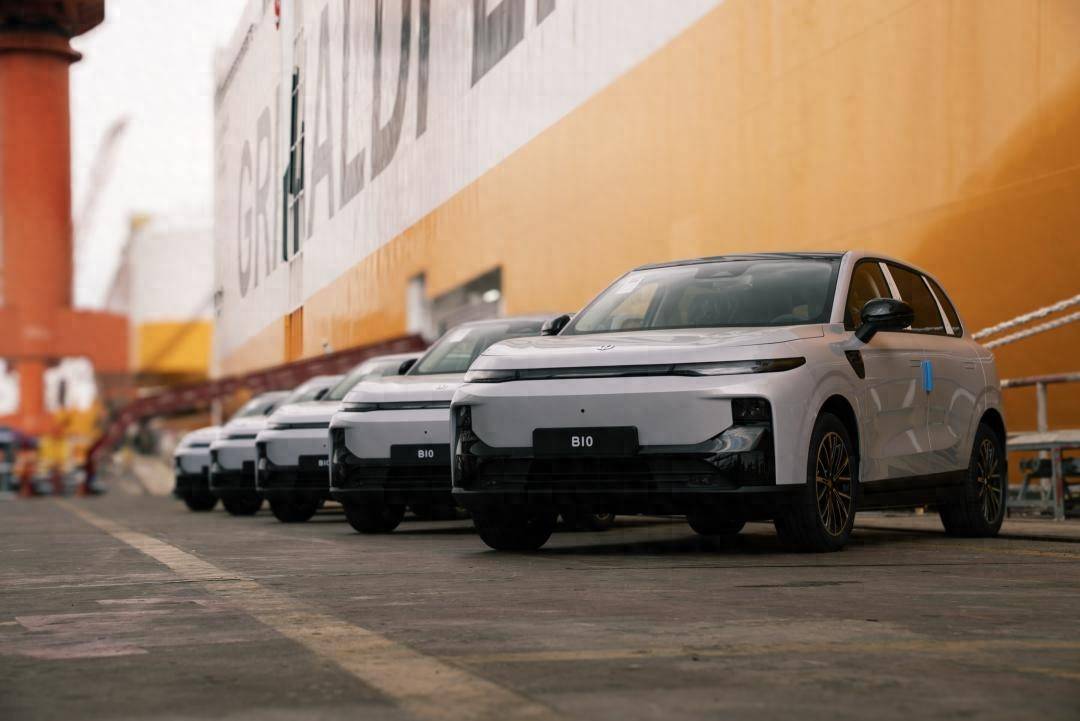
The key turning point was April 2026, when China's NEV exports reached 406,000 units, accounting for 52.7% of total automobile exports for the month, surpassing fuel vehicles in the export structure for the first time Sina Auto. This milestone marks a fundamental switch in the driving engine of China's automobile exports — from the past fuel-vehicle dominance (in 2021, NEV exports accounted for less than 15%) to NEVs taking the comprehensive lead. In terms of absolute growth, the 103.7% increase in NEV exports in 2025 nearly doubled, whereas the NEV export growth rate in 2024 was only 6.7%. Some analysts attribute the 2024 slowdown to corporate wait-and-see attitudes amid expectations of EU anti-subsidy investigations, followed by a retaliatory rebound in 2025.
Even more noteworthy is the endogenous shift in momentum. The share of Chinese domestic brands in exports rose from less than 40% in 2021 to over 80% in 2025, while foreign brands (Tesla, BMW, etc.) saw their combined share drop by nearly 40 percentage points IEA Global EV Outlook 2026. Battery Electric Vehicles (BEV) and Plug-in Hybrid Electric Vehicles (PHEV) are driven by dual engines: in 2025, BEV exports reached 1.646 million units (+66.7%) and PHEV exports reached 969,000 units (+230%), with PHEV growth far exceeding BEV — under EU tariff barriers, PHEVs are becoming a strategic tool for Chinese automakers to rapidly switch tracks Sina Auto.
Summary: China's automobile exports have completed the leap from "quantitative change" to "qualitative change." In the first five months of 2026, NEV exports have already approached 70% of the full-year 2025 level, and full-year NEV exports are expected to exceed 4 million units. The average export price has surpassed $35,000, and the brand image is shifting from "low-price volume" to "quality-driven globalization."
1.3 Regional Competitive Positioning: Europe Defending, Emerging Markets Breaking Through
The distribution of China's NEVs across major global regions presents a distinctive gradient structure. Based on IEA data and industry reports, the following competitive positioning matrix can be constructed:
Four-Region Competitive Positioning Comparison
| Dimension | Europe | Southeast Asia | Latin America | Middle East & Africa |
|---|---|---|---|---|
| Strategic Positioning | Brand value high ground | Production capacity "base camp" | Incremental "blue ocean" | Policy-driven new growth pole |
| 2025 Growth Rate | +50% (sales ~940k units) | +130% (imports doubled, exceeding 300k units) | +55% | +60% (Middle East) |
| Chinese Brand Position | <20% of EU EV demand | Thailand market share >50% | >80% of imports from China | Saudi Arabia/UAE "Vision 2030" core |
| Localization Progress | BYD European registrations surged 276% | BYD Thailand annual production 150k+; Indonesia >200k | BYD Brazil 300k capacity base | Australia market share 25% (ending 28-year Japanese monopoly) |
| Core Barriers | Countervailing duties (max >35%), export licensing system | Narrowing policy window | Insufficient infrastructure | Long market cultivation cycle |
Europe: The "Assault Zone" of the Premium Market
In 2025, China-made electric vehicles sold approximately 940,000 units in the European market, a year-on-year increase of nearly 50%. The EU imported over 900,000 electric vehicles, of which approximately 60% came from China, equivalent to less than 20% of EU electric vehicle demand IEA Global EV Outlook 2026. BYD's registrations in Europe reached 159,900 units in the first 11 months of 2025, a year-on-year surge of 276% CnEVPost. However, Europe's share of China's total EV export value has declined from a peak of over 50% to approximately 40% in 2025, reflecting a trend of market diversification IEA Global EV Outlook 2026. Trade barriers are the core challenge: EU countervailing duties have a maximum rate exceeding 35%, China implemented an export licensing system for pure electric vehicles in January 2026, and overseas inventory backlogs (exports exceeding actual sales by approximately 25%) also constitute short-term pressure.
Southeast Asia: The "Base Camp" in the Near Neighborhood
In 2025, overseas sales of Chinese electric vehicles in Southeast Asia grew 130% year-on-year, with imports doubling to over 300,000 units, almost entirely from China IEA Global EV Outlook 2026. Chinese brands' market share in Thailand's electric vehicle market has exceeded 50%, and BYD has built a production base with an annual capacity of 150,000 units in Thailand Sina Auto. IEA data shows that Southeast Asia already accounts for over half of Chinese automakers' overseas manufacturing footprint (Thailand over 30%, Indonesia over 20%).
Latin America: The Rapidly Penetrating "Blue Ocean"
In 2025, Chinese electric vehicle sales in Latin America grew 55%, with over 80% of electric vehicles imported from China in multiple countries IEA Global EV Outlook 2026. Brazil is one of the largest single markets for China's NEV export growth 10jqka. BYD has announced a production base investment in Brazil with an annual capacity of 300,000 units, and Great Wall Motor's Brazil factory is expected to commence production in 2027 Sina Auto.
Middle East & Africa: Policy-Driven New Growth Poles
The Middle East market grew 60%, with Saudi Arabia and the UAE's "Vision 2030" positioning electric vehicles as a core pathway for economic diversification Sina Auto. The African market, while small in base, has enormous growth potential. Notably, China has ended the 28-year monopoly of Japanese brands in the Australian market, with its market share jumping to 25% MOFCOM Mumbai Consulate.
Summary: China's NEV global expansion is shifting from "single-point breakthrough in Europe" to "global multi-point coverage." Europe remains the brand value high ground, but Southeast Asia and Latin America have become the primary engines of sales growth.
The IEA forecasts that by 2035, the share of China-made electric vehicles in developed economy sales will rise from 15% in 2025 to 25% (approximately 6 million units), while in emerging markets, the share will decline from nearly two-thirds to below 25% — this "bidirectional convergence" reflects the long-term trend of global supply chain diversification IEA Global EV Outlook 2026.
1.4 Brand Strength Benchmarking: The Rise of Chinese Automakers in the Global EV Landscape
2025 was a turning point for the global EV brand landscape. BYD's full-year BEV sales reached 2,256,714 units (a 27.86% year-on-year increase), surpassing Tesla's 1,636,129 units (an 8.56% year-on-year decline) for the first time to be crowned the global pure electric vehicle sales champion CnEVPost. Including plug-in hybrid vehicles, BYD's total NEV sales in 2025 reached 4.6024 million units CleanTechnica BYD Announcement/CRI Online.
Looking at the global Top 10 EV brand landscape, the presence of Chinese companies continues to strengthen:
| Rank | Brand | Country | 2025 Sales (10k units) | Market Share | Remarks |
|---|---|---|---|---|---|
| 1 | BYD | China | 419.38 | 20.35% | Continued lead, nearly 2.5x Tesla |
| 2 | Tesla | USA | 163.60 | 7.94% | YoY -8.5%, share declining year after year |
| 3 | Geely | China | 126.90 | 6.16% | YoY +161%, first time in top three |
| 4 | Wuling | China | 81.48 | 3.95% | Hongguang MINIEV as mainstay |
| 5 | Leapmotor | China | 61.71 | 2.99% | Jumped 6 places from 12th |
| 6 | Volkswagen | Germany | 59.66 | 2.89% | Fastest transforming legacy automaker |
| 7 | BMW | Germany | 56.01 | 2.72% | Steady premium EV growth |
| 8 | XPeng | China | 42.94 | 2.08% | YoY +126%, first time in top ten |
| 9 | AITO | China | 42.51 | 2.06% | Huawei-enabled, YoY +17% |
| 10 | Xiaomi | China | 41.21 | 2.00% | Entered top ten with only two models |
Note: Total global EV (BEV+PHEV) sales in 2025 were approximately 20.61 million units. Among the Top 10 brands, Chinese brands occupied 7 seats, with combined sales of approximately 8.36 million units, accounting for 62% of the Top 10 total CleanTechnica. In January–May 2026, Chery led Chinese automaker exports with 749,000 units, followed by BYD (617,000 units) and SAIC (459,000 units) 10jqka.
Summary: The competitiveness of Chinese brands in the global EV market has evolved from "quantitative advantage" to "brand momentum." BYD surpassing Tesla is not the endpoint, but rather the beginning of the collective rise of the Chinese EV legion. Behind this landscape lies supply chain depth — China accounts for over 80% of global power battery production, approximately 85% of cathode materials, and over 90% of anode materials — forming a systemic competitive advantage that is difficult to replicate in the short term IEA Global EV Outlook 2026.
Chapter Summary
From 2023 to 2026, the global NEV passenger car market completed a scale leap from the 10-million to the 20-million level, with China playing an irreplaceable core role: contributing approximately 60%–65% of sales, nearly 75% of production, and over 80% of battery capacity. On China's automobile export side, the NEV share surged from 24.5% (2023) to 48% by May 2026, with April marking the first time it exceeded 50% — a historic milestone. At the regional level, Europe remains the brand value high ground but trade barriers are intensifying; Southeast Asia and Latin America are becoming new growth engines; and the Middle East and Africa hold long-term potential. At the brand level, BYD surpassing Tesla and Chinese brands occupying 7 of the Top 10 EV brands mark a new phase in the global EV competitive landscape — transitioning from "Western-dominated" to "bipolar contest with China leading."
Related Posts